Reports & analytics
Storage, quota, storage-by-project, upload activity and deliveries.
The Reports page is your one-screen read on the operation: how much storage you've used, how many albums you've created against your plan, which projects are heavy, how busy the team has been, and how many jobs you've shipped. Every member of the org can open it, and it reflects the albums you own (the ones you created), so each person sees their own slice. Web
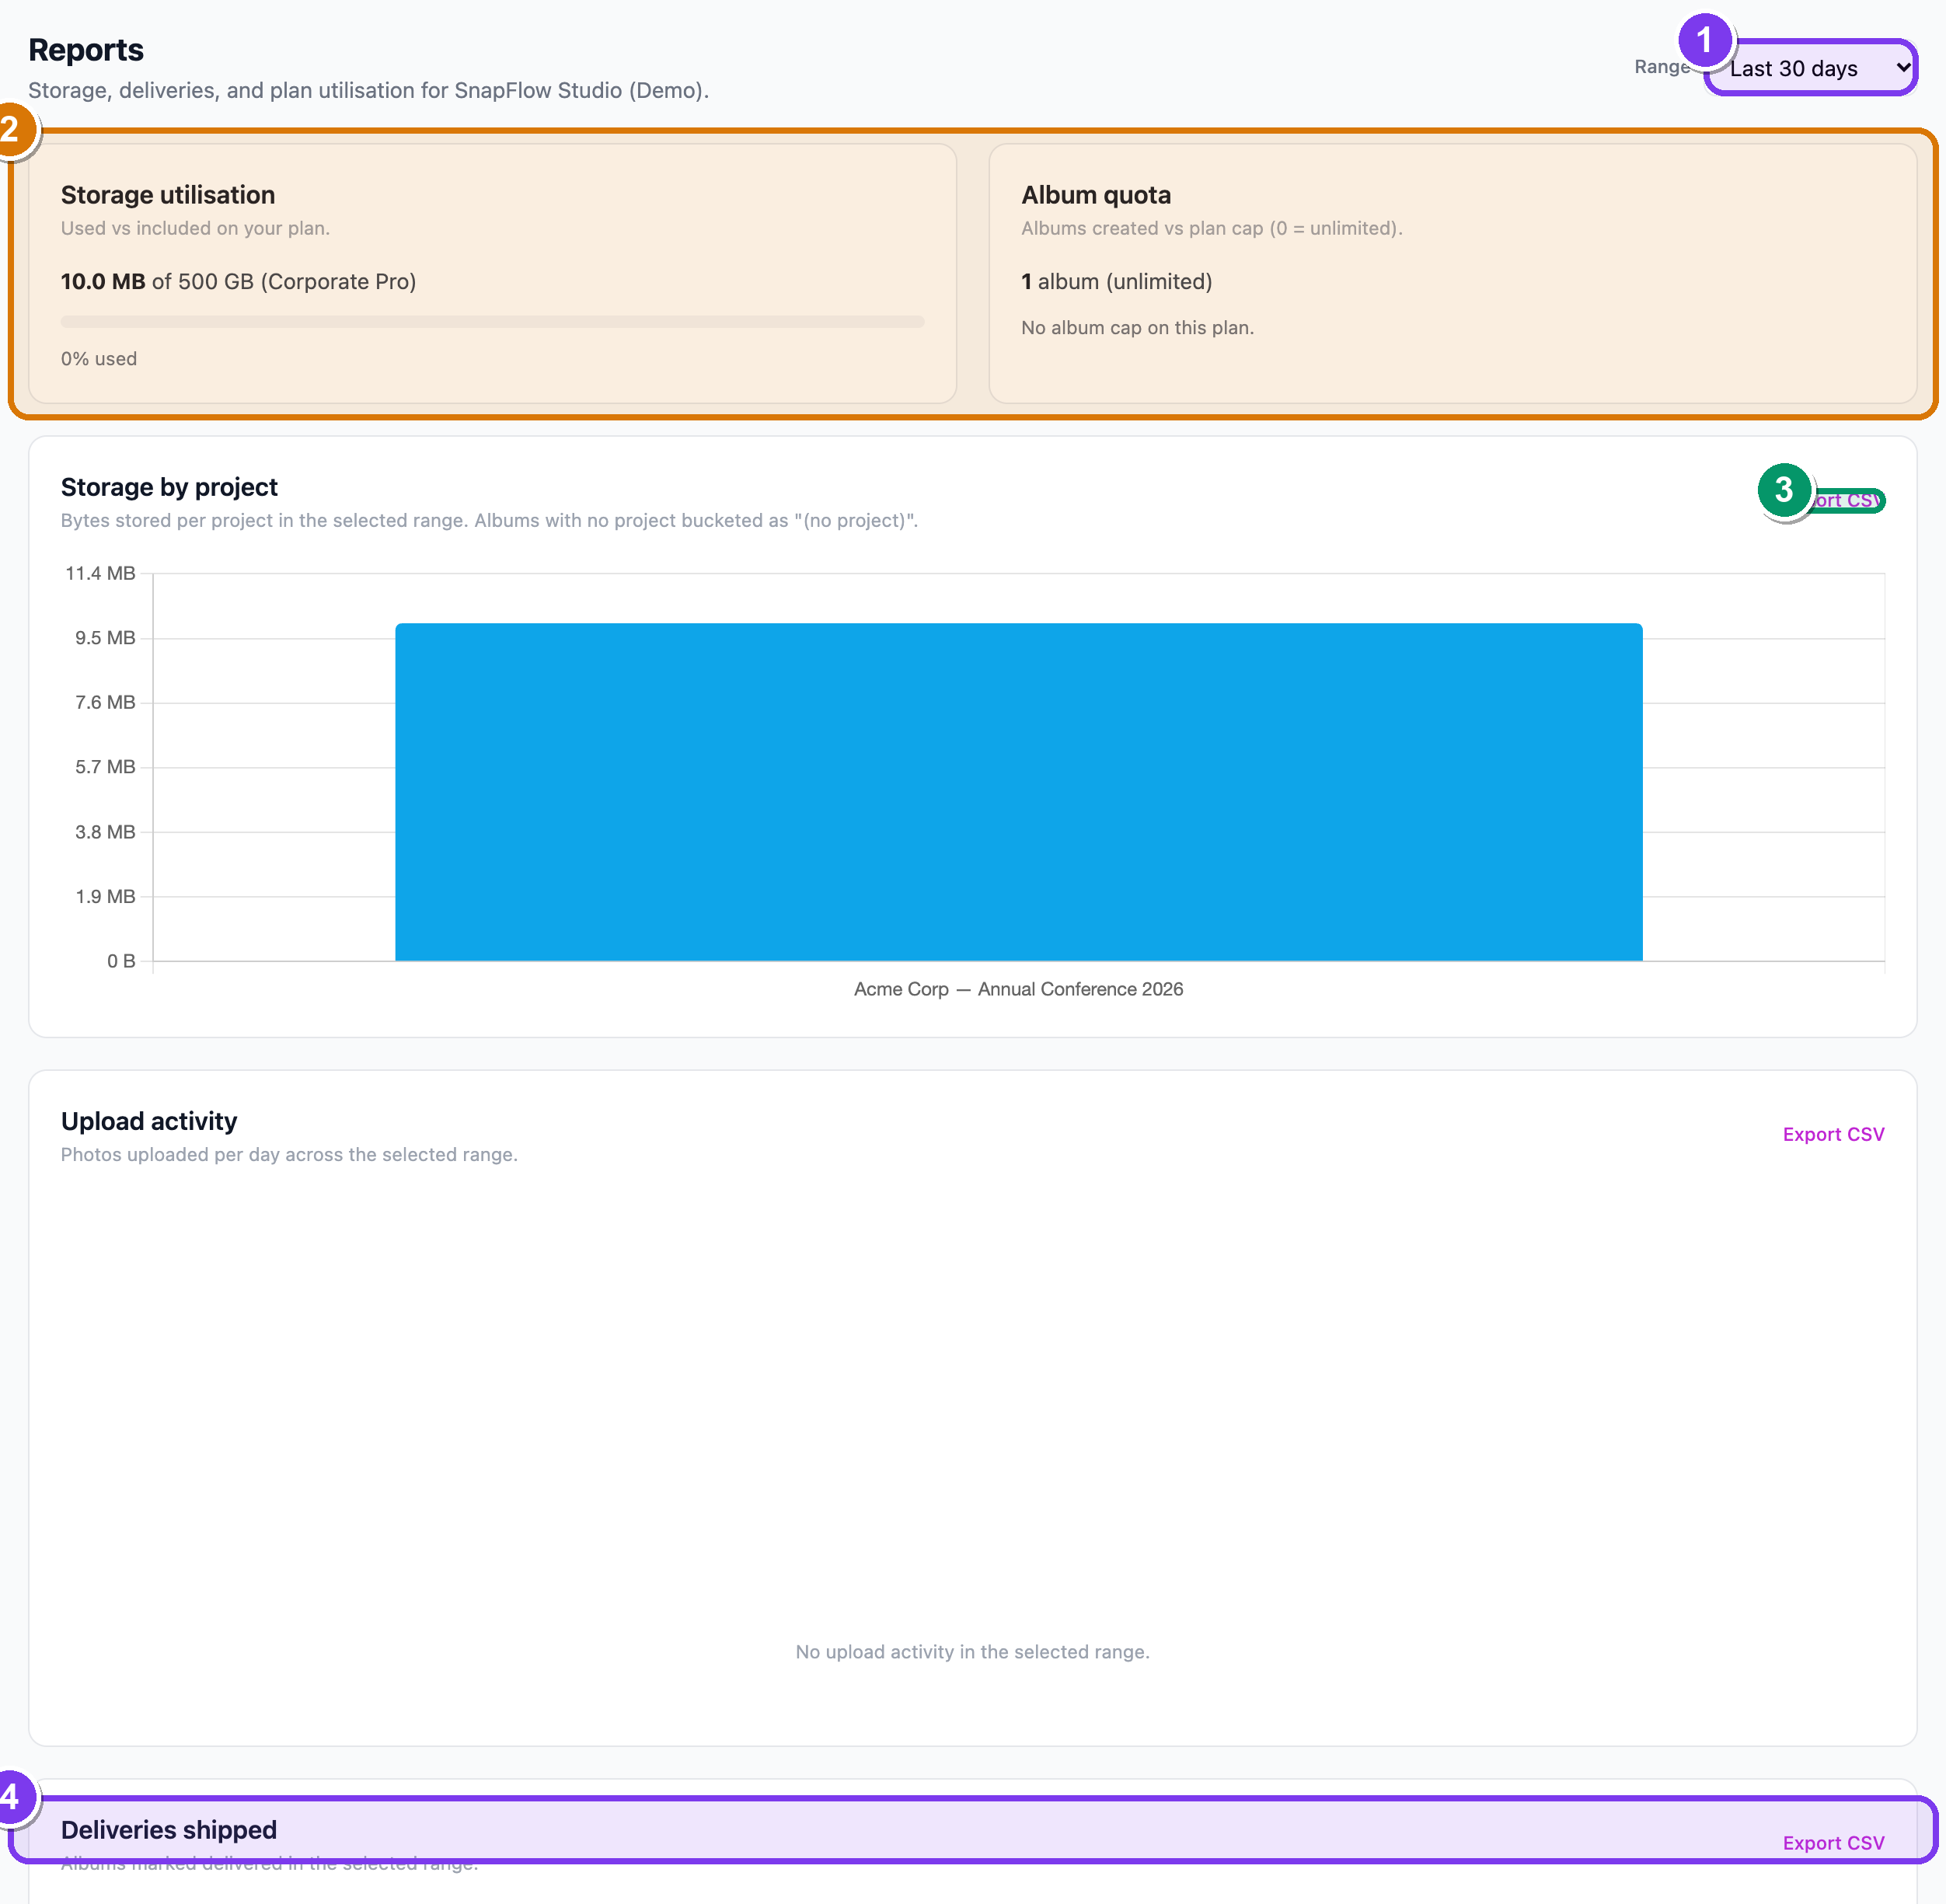 The Reports page. ① the Range dropdown (top-right) sets the time window for every section below. ② the Storage utilisation and Album quota cards (these show your current state, no range). ③ the Export CSV link that sits on three of the lower sections. ④ the Deliveries shipped count at the bottom.
Opening the page
- Sign in at snap-flow.org, then look at the top navigation bar. — you'll see your org's menu items across the top.
- Click Reports. — the Reports page opens at
/admin/reports, with the header "Storage, deliveries, and plan utilisation for <your org>."
Reports is org-only, and per-member
The Reports item only shows for organisation and agency accounts — a solo photographer gets the same numbers from their dashboard summary instead. And the figures reflect the albums you own, not the whole org rolled up: a manager sees their own albums, the owner sees theirs. The personal Reports destination (storage, plan, gear, activity, deliveries) covers the same ground for solo accounts — see the Reports dashboard guide.
Setting the time window
Most of the page is filtered by a date range that you pick once at the top.
- In the top-right, find the Range dropdown. — it starts on Last 30 days.
- Click it. — four choices drop down: Last 7 days, Last 30 days, Last 90 days, Last 365 days.
- Pick one. — every range-aware section below refreshes in place; you don't reload the page.
What the range does and doesn't touch
The range changes Storage by project, Upload activity and Deliveries shipped. It does not change the two cards at the top — Storage utilisation and Album quota always show your current state right now, not a window in time.
What each section tells you
Storage utilisation
The first card, Storage utilisation ("Used vs included on your plan."), shows how much of your plan's included storage you've used. You'll see your used amount, your plan's limit, and a bar.
- The bar is brand-blue when you're comfortably under, turns amber as you pass roughly 70%, and turns red above roughly 90%. — colour is your at-a-glance early warning.
- A line underneath reads "{N}% used". On an unlimited plan you'll see "Unlimited storage on this plan." instead of a bar.
Album quota
The second card, Album quota ("Albums created vs plan cap (0 = unlimited)."), shows how many albums you've created against your plan's cap. — same amber/red bar idea. If your plan has no cap you'll see "No album cap on this plan."
These two cards are your fuel gauges
Storage utilisation and Album quota are the early-warning lights. When either nears its limit it's time to archive old work, prune photos, or look at your plan. The owner can buy more storage or change plan from Billing & ownership.
Storage by project
Storage by project ("Bytes stored per project in the selected range.") is a bar chart of how many bytes you're holding per project, so you can see which jobs are heavy and which clients to bill for archive. — taller bar = more storage.
- Albums that aren't attached to a project are grouped into a single "(no project)" bar. — so loose albums still count toward the picture.
- If there are no uploads in the chosen range you'll see "No uploads in the selected range yet."
Upload activity
Upload activity ("Photos uploaded per day across the selected range.") is a day-by-day bar chart — the pulse of how busy the team has been. — busier days are taller. With nothing in range you'll see "No upload activity in the selected range."
Deliveries shipped
Deliveries shipped ("Albums marked delivered in the selected range.") is your output as a studio. — a big number at the top reads "N albums delivered", with a short list of the most recent ones and their delivery dates underneath.
Pulling the figures out
Three of the lower sections carry an Export CSV link in their top-right corner: Storage by project, Upload activity and Deliveries shipped.
- Pick your Range first (the export follows whatever window is selected).
- On the section you want, click Export CSV (top-right of that card). — a CSV file downloads for that section and that range, ready to open in a spreadsheet.
Only three sections export
There's no Export CSV on the two top cards (Storage utilisation and Album quota) — those are a current-state snapshot, not a range you'd put in a spreadsheet. Export lives on Storage by project, Upload activity and Deliveries shipped only.
Next: Branding & white-label.